NotebookLM is an incredible tool for synthesizing complex information, but turning that data into a visual “Action Blueprint” requires a specific bridge between the text and the image generator.
These 8 prompts are engineered to first analyze your uploaded sources and then translate that intelligence into professional-grade illustrations.

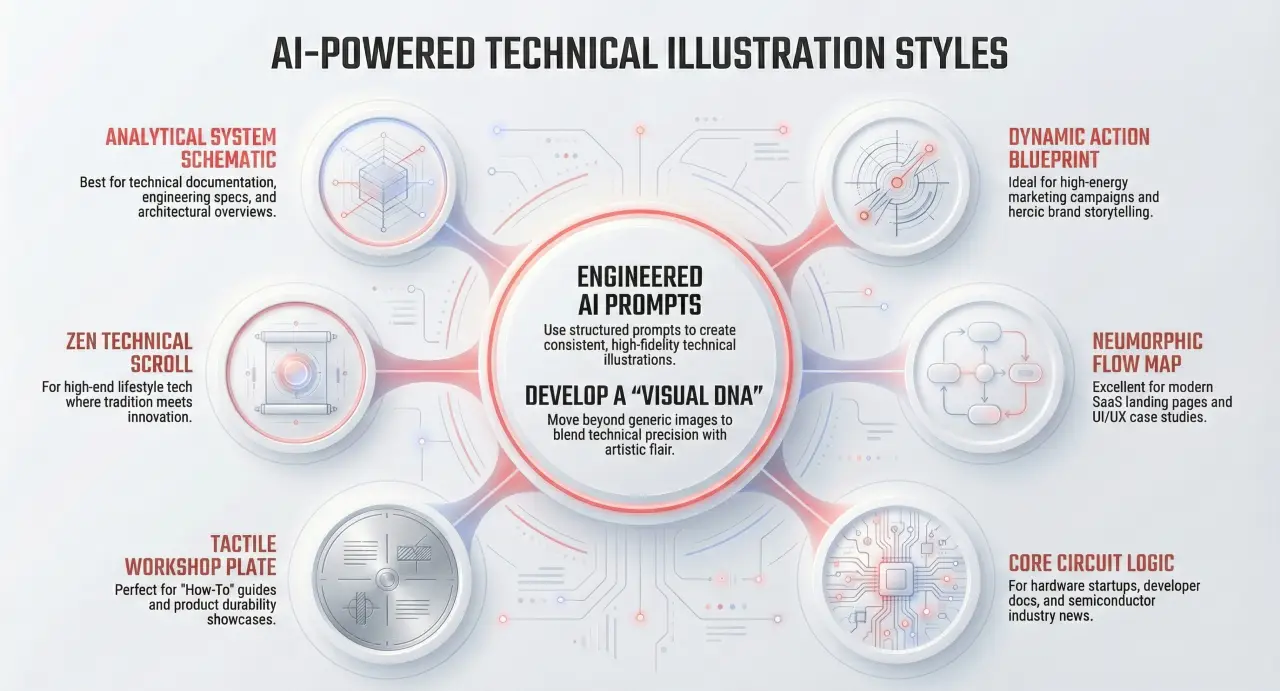
1. The Dynamic Action Blueprint
Use Case: Ideal for summarizing a breakthrough concept found in your notes using a high-energy, “heroic” brand story. Use this for educational summaries where you want to highlight key “milestones” from your sources.
Full Prompt: Instruction: Analyze the provided sources in this notebook. Identify the core “hero” subject and key informational callouts. Using that data, create a high-fidelity infographic in a “Retro-Comic Action Blueprint” style. Overall Tone: Energetic and authoritative. Colors: Background #FFDD00, Text #000000, Accent #FF3333. Visual Elements: Thick black ink outlines, Ben-Day dot shading, and dynamic motion lines. Composition: The central subject from the sources serves as the focal point, surrounded by callouts organized in jagged bursts and comic strips. Typography: Heavy, condensed comic-book style display font (All-Caps).
2. The Analytical System Schematic
Use Case: Best for engineering notes, product manuals, or architectural breakdowns. Use this when you need a visual “exploded view” of a system described in your documents.
Full Prompt: Instruction: Study the technical specifications in the available sources. Extract the structural components of the primary object described. Create a high-fidelity “Engineering Blueprint Schematic” based on these components. Overall Tone: Precise and engineered. Colors: Background #0b1623, Text #f0f0f0, Accent #ff9f30. Visual Elements: Exploded view wireframe, angular leader lines, and a drafting grid. Composition: A centralized exploded artifact derived from the sources, surrounded by modular data clusters. Lighting: Flat, high-contrast schematic illumination. Typography: Condensed Sans-Serif (DIN or Roboto Condensed).
3. The Thermal Insight Display
Use Case: Perfect for visualizing data trends, cybersecurity threats, or efficiency reports found in your research. It turns abstract “hot spots” in your data into a futuristic HUD.
Full Prompt: Instruction: Review the data points and metrics within the notebook sources. Identify the “high-intensity” areas or key findings. Generate a “Thermal Insight Tech” infographic visualizing these priorities. Overall Tone: Analytical and futuristic. Colors: Background #050B26, Text #FFFFFF, Accent #FFC800. Visual Elements: Thermal heat map spectrums, technical HUD overlays, and wireframe crosshairs. Texture: Digital smooth with luminous neon gradients. Composition: Central subject flanked by symmetrical feature grids based on source data. Typography: Bold Sans-Serif Condensed Uppercase.
4. The Neumorphic Flow Map
Use Case: Use this to visualize workflows, organizational structures, or “hub-and-spoke” relationships detailed in your uploaded notes.
Full Prompt: Instruction: Identify the central theme and the peripheral supporting points from the sources. Create a “Neumorphic Tech Schematic” that maps the relationship between these elements. Overall Tone: Professional and sleek. Colors: Background #F4F6F8, Text #2C2C2C, Accent #EB5757. Visual Elements: Centralized hub-and-spoke layout, gradient flow lines, and soft circular containers. Lighting: Soft, diffuse ambient lighting creating a neumorphic effect. Typography: Condensed Sans-Serif, Uppercase, Bold.
5. The Zen Technical Scroll
Use Case: Best for historical research, philosophical texts, or creative synthesis where you want to blend modern data with a “timeless” aesthetic.
Full Prompt: Instruction: Extract the core narrative or cultural themes from the sources. Generate a “Sumi-e Tech Scroll” that illustrates these concepts through a blend of traditional art and modern diagrams. Overall Tone: Sophisticated and culturally fused. Colors: Background #F4F1E8, Text #0D0D0D, Accent #8A1C15. Texture: Aged rice paper grain and ink bleed. Composition: Bilateral symmetry with iconographic illustrations paired with text blocks derived from the source material. Typography: Classical Serif.
6. The Celestial Gearbox
Use Case: Ideal for “exploratory” notes—scientific discoveries, space research, or imaginative “what-if” scenarios grounded in your data.
Full Prompt: Instruction: Identify the most innovative or “frontier” concepts in the sources. Create a “Steampunk Nebula Explorer” illustration that frames these concepts as components of a mechanical cosmic voyage. Overall Tone: Adventurous and industrial. Colors: Background #0d1b33, Text #2b1d0e, Accent #cd7f32. Visual Elements: Steampunk gears and copper piping connecting data points extracted from the text. Texture: Weathered paper and brushed bronze. Typography: Vintage Condensed Slab Serif.
7. The Core Circuit Logic
Use Case: Perfect for documenting software logic, hardware connectivity, or “foundational” processes described in your notebook.
Full Prompt: Instruction: Map out the logical connections or “traces” between the entities described in the sources. Generate a “PCB Schematic Architecture” illustration based on this network. Overall Tone: Precision-engineered. Colors: Background #0F3B2C, Text #EAD0AC, Accent #D98C53. Visual Elements: Circuit board traces, solder pads, and IC chip outlines representing core source modules. Composition: A network-based layout with a central core connected to peripheral data clusters via grid-aligned paths. Typography: Industrial Monospace.
8. The Tactile Workshop Plate
Use Case: Best for “practical” sources—instructional guides, durability tests, or manufacturing data. It gives your research a “real-world,” physical presence.
Full Prompt: Instruction: Analyze the physical components or mechanical steps detailed in the sources. Create an “Industrial Workbench Schematic” that displays these elements as if they were part of a physical workshop project. Overall Tone: Rugged and reliable. Colors: Background #cfd3d6, Text #1f1f1f, Accent #ffc107. Visual Elements: Photorealistic hardware integrated with 2D schematic diagrams based on the data. Texture: Brushed aluminum and industrial grit. Typography: DIN Condensed or Impact.
Pro-Tip for NotebookLM Users
To get the best results, ensure your Source Guide is well-organized. The AI will pull the most relevant “entities” and “key quotes” from your documents to populate these visual layouts.